All How to Detect Data Drift Before Your Models Fail
Updated:April 29, 202610 min read


Designing a great machine learning model is just the first step. The actual challenge lies in maintaining its accuracy over time. As of now, 78% of organizations use AI in at least one area, and even more are expected to adopt it in critical sectors like healthcare, retail, and finance. With this shift, ML model drift has become a hidden threat to returns on investment.
Data drift happens when input data changes over time, which leads to errors in the model. This change might be obvious, but often it's just gradual. The performance is quietly undermined until issues like lower revenue or customer complaints arise. When users experience mistakes or irrelevant results, trust in your AI-powered solution can decrease.
In this article, SapientPro’s engineering team explores what data drift is and how to detect it before it harms your model's performance.
Key Takeaways
- Data drift occurs when the data used by a model changes over time, causing errors;
- Many industries face seasonal changes that impact their data;
- Data drift and concept drift are two types of data drift in machine learning;
- If ignored, LLM model drift can cause major problems like financial losses, operational issues, and harm to trust and reputation.
What is Data Drift?
In case the input data for a machine learning model alters over time, data drift could happen. It basically differs from the data the model was trained on. Your model can become less accurate after this shift because it's designed to work best with data similar to what it was trained on. If data drift detection is ignored, machine learning models can lose over 40% accuracy in just one year.
If the new data differs too much, the model may stop making accurate predictions. Finding and fixing data drift is a must to keep machine learning models reliable as things change.
For example, an online shopping website uses a machine learning model to suggest products based on what users have browsed or bought in the past year. Before the holidays, people's buying habits change a lot. They start purchasing more gifts, like toys, which weren't a focus when the model was trained.
Because of this change, the model's recommendations become less precise. They don't match what users are interested in or what's popular now.
Why do Machine Learning Models Drift?
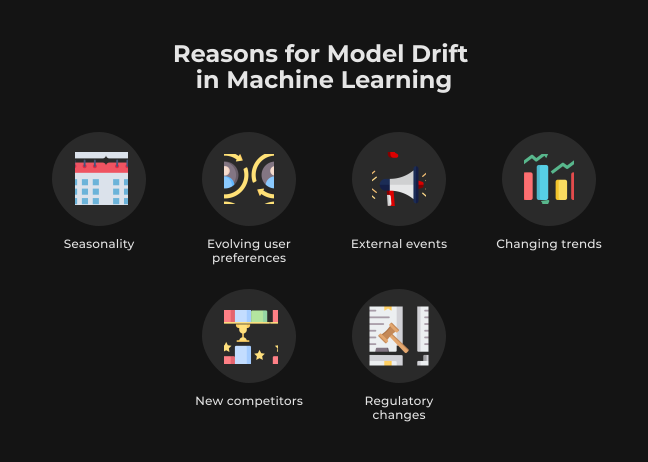
Data is always changing, and this happens due to:
- Seasonality. Many industries experience regular seasonal shifts that affect their data. These could be holiday shopping spikes in retail or weather impacts in agriculture. A model trained out of season might not work well during these times.
- Changing trends. Consumer trends and new technologies often change data patterns. For example, if a model learned from past laptop buying habits, it might miss a sudden interest in new types.
- Evolving user preferences. User tastes can't stay the same all the time. A recommendation system may not always keep up if it depends on outdated interactions only.
- New competitors. New competitors can change customer behavior when they enter a market. This can result in data that is different from what a model was trained on.
- Regulatory changes. New laws, especially about data privacy, can change how businesses collect data. This can affect the features available for models.
Types of Drift in Machine Learning
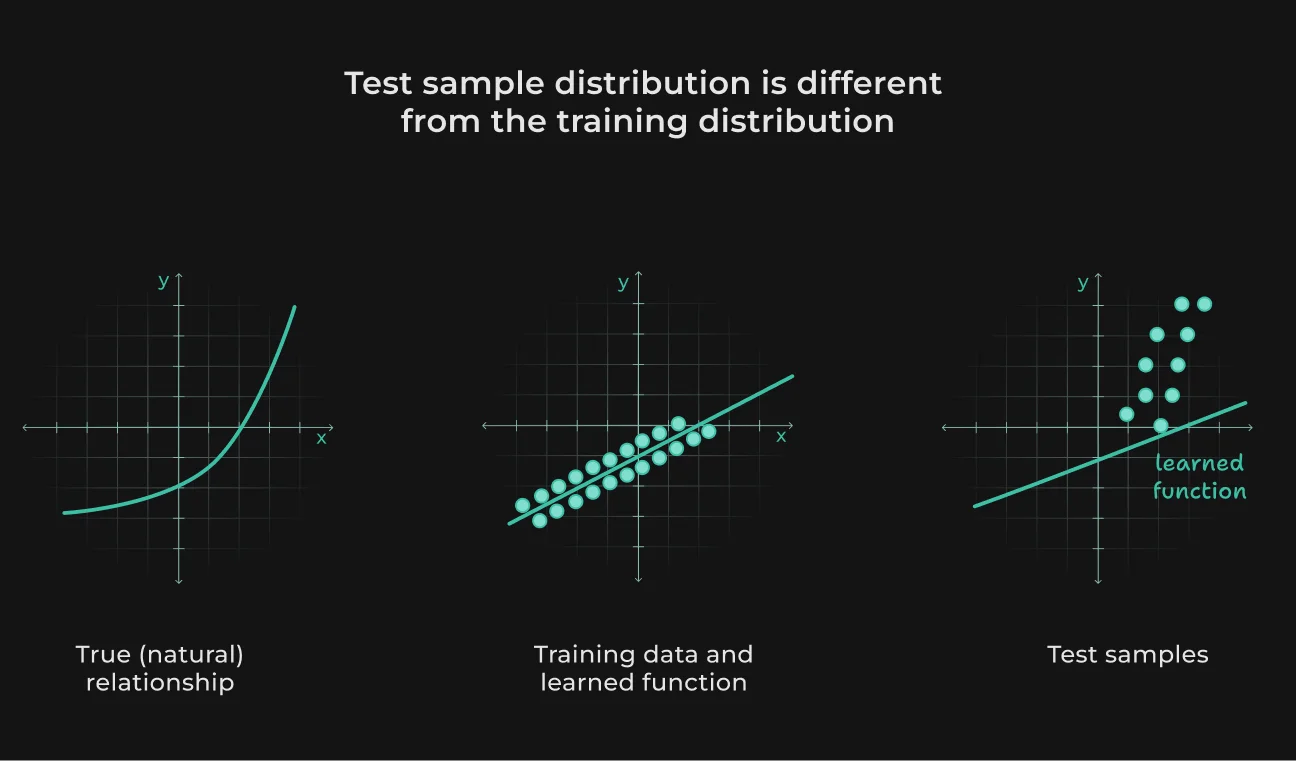
During a machine learning model's training, it's commonly supposed that the data's statistical properties will always remain the same. In reality, though, this isn't so. Different factors change, which makes your model perform poorly on new data, even if it did well during testing.
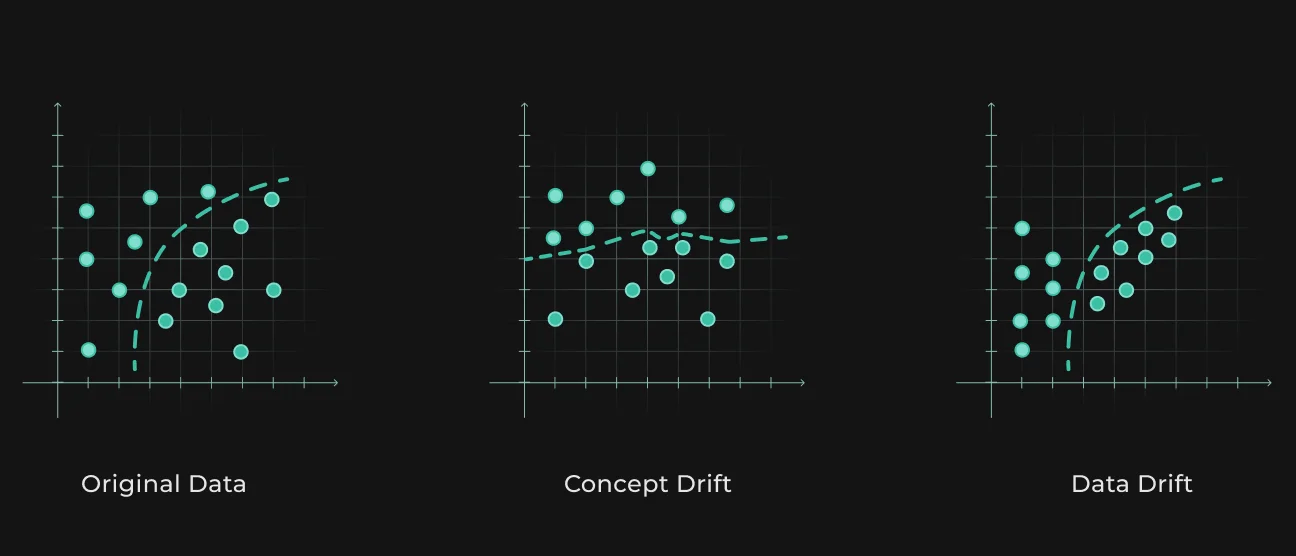
A combination of concept drift vs data drift are terms that describe these changes.
Data Drift
There are three basic types of data drift. Let's check them out below.
Covariate Shift
Covariate shift occurs when the input data changes, but the relationship with the target variable stays the same. For example:
- A housing price model might notice that larger houses become more common;
- An e-commerce recommendation model might work with a younger demographic as time goes on.
Try to update the model with new data that reflects the current inputs. Also, you can use techniques like weighted sampling or domain adaptation to avoid this type of drift.
Label Shift
In this type of drift, the target variable's distribution changes, but its relationship with the features stays the same. For example, the number of fraudulent transactions might rise or decline. Examples include:
- An increase in spam versus regular emails;
- A change in the ratio of fraudulent to non-fraudulent financial transactions;
- A shift in the proportion of disease diagnoses.
In order to maintain balance, you can try resampling data, creating synthetic examples, or adjusting decision thresholds.
Prior Probability Shift
Prior probability shift happens in machine learning when the likelihood of different classes changes from training to deployment, while the way data is distributed within each class stays the same. This issue is important in classification tasks.
If we don't account for this shift, a model might become biased. For example, if spam emails increase after training, the model might underpredict them because it was trained when there were fewer spam emails.
You can use models that adapt to changes in class distributions to protect your model from this shift. This can involve real-time drift monitoring and retraining strategies.
Concept Drift Detection
Concept drift in machine learning starts when the relationship between input and output data changes over time. The “concept” refers to the hidden, unknown connections between these variables. For example:
- Weather data can be affected by the season and might not be explicitly included in the data;
- Changes in the economy can alter customer buying habits, though this isn't directly seen in the data.
All similar kinds of influences are known as hidden context.
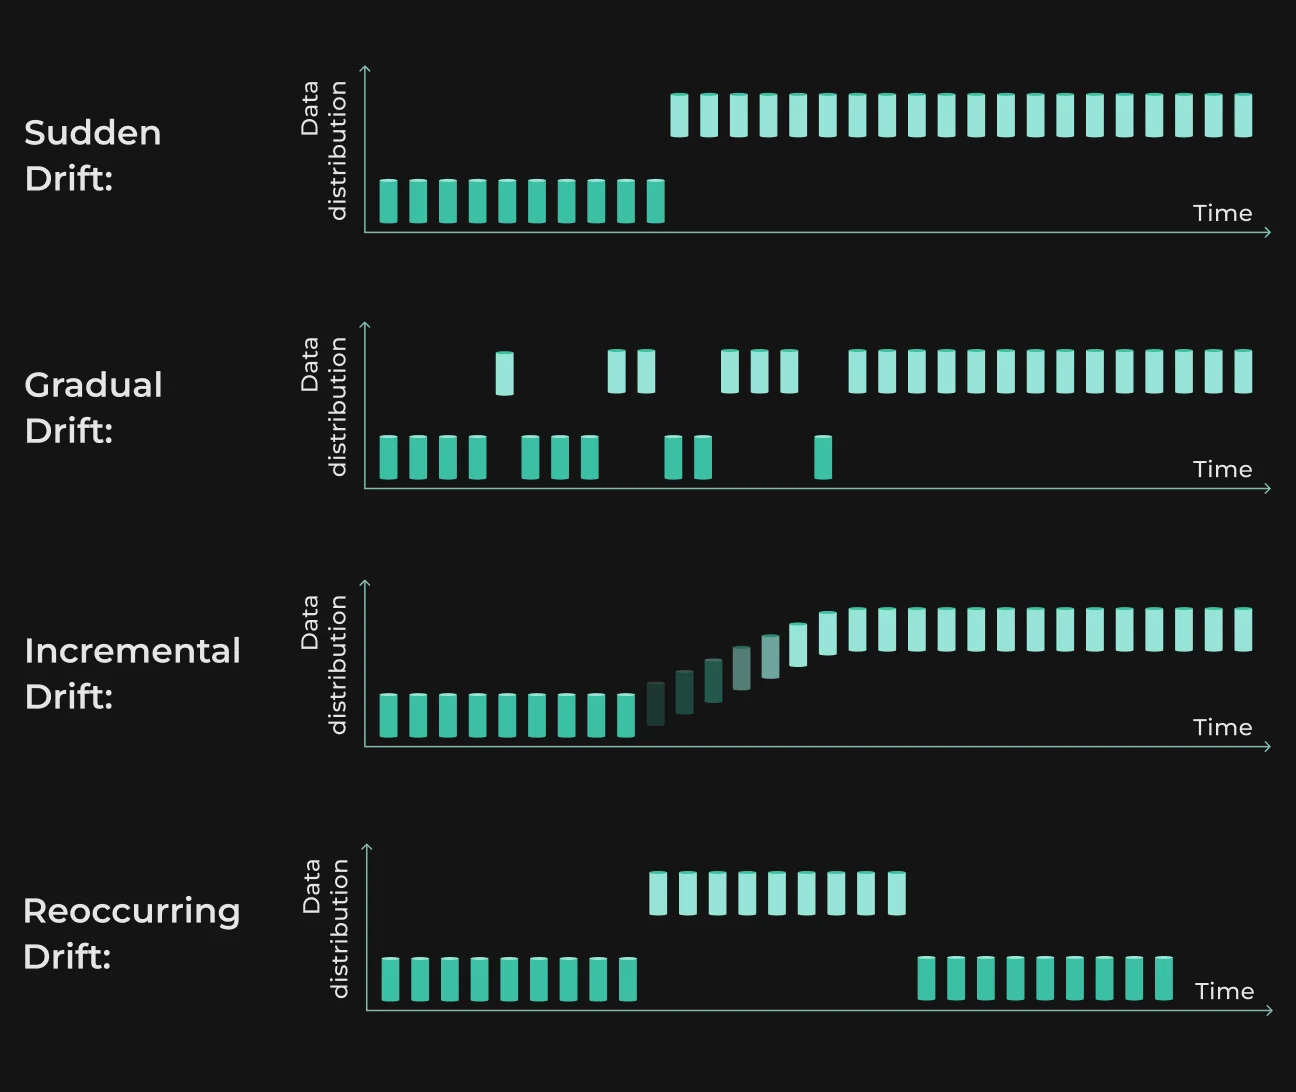
Let's now explore several types of concept drift:
- Sudden drift. Sudden drift appears when the relationship between input and output variables quickly changes. For example, during the pandemic, consumer buying habits shifted abruptly and impacted many predictive models;
- Gradual drift. This means the concept evolves gradually. For example, consumer preferences may change slowly when new technologies emerge;
- Incremental drift. This is like gradual drift, where slow, ongoing changes slowly affect a model's predictions;
- Recurring drift. This drift is mostly seasonal. For example, e-commerce habits often change during holidays or annual sales events, showing recurring patterns.
Danger of Ignoring Model Drift AI in Your Models
Ignoring data drift in machine learning models can lead to big trouble, including losing money, messing up operations, and damaging trust and reputation.
Financial Losses
During data drifts, prediction models can make wrong predictions, especially those used for big decisions. For example, a credit-scoring model might not keep up with how people borrow or market changes. This can lead to risky loans or the loss of loyal customers.
These mistakes can also increase expenses. In marketing, a recommendation system, which deals with data drift, might suggest the wrong products.
If businesses can't follow data changes, they risk missing out on upselling or cross-selling opportunities. They may even lose market share to quicker competitors.
Operational Inefficiencies
Old models can waste resources. If a demand forecast is wrong, the supply chain might produce too much or too little stuff.
With constant changes, machine learning systems can face downtime if models start flopping. This is super important in manufacturing or logistics, where small mistakes can cause big issues.
Old systems can also lead to mistakes. Take a chatbot, for example. If it's outdated, it might give poor-quality customer support since it doesn't get the latest trends.
Loss of Trust and Reputation
If customers keep getting bad service or advice, they might lose trust in your product or service.
When data drift leads to big issues (like a prediction model flopping or a medical device causing trouble), it can lead to bad publicity and long-term damage to your brand’s reputation.
In tightly regulated industries, not handling data drift can mean breaking the law, facing fines, and losing trust.
How to Detect Drift in Your Machine Learning Model
To keep your predictions in a machine learning model accurate and reliable, whatever changes happen, it's key to know how to detect a drift. Here's a look at different ways to identify it.
1. Statistical Approaches: Quantitative Methods for Early Warning
Statistical methods use math to see changes in data patterns. These techniques can give strong proof of data shifts by analyzing the numbers. For example,
Kolmogorov-Smirnov (KS) Test
The KS test measures how different two sample distributions are. It's a nonparametric test that can detect changes in the center and shape of the data.
This kind of test is perfect for analyzing continuous data, like comparing sales prices before and after a big market event. If the KS statistic (the biggest difference between cumulative distributions) is greater than a critical value, it indicates a significant change.
Population Stability Index (PSI)
PSI tracks changes in population traits, and often in categories like credit scores. It compares expected data to what is currently happening.
PSI measures the difference between what was anticipated and what is observed. It highlights any noticeable shifts that go beyond set limits, like differences over 0.2.
Jensen-Shannon Divergence (JSD)
JSD is a symmetric measure that shows how similar two probability distributions are. It's easier to interpret than methods like Kullback-Leibler divergence.
It's ideal for any kind of categorical data, like tracking user interactions in a digital app. JSD calculates the average information gain from one distribution to another, giving a clear view of the differences.
Chi-Square Test
This test scans for vital differences between frequencies (both expected and observed). It's often used to analyze categorical data, like changes in customer demographics.
Chi-square test helps analyze how well the data aligns with what's expected. It also alerts you to changes when the statistic exceeds a specific limit.
2. AI-Powered Alerts: Model-Based and Unsupervised AI Model Drift Detection Tools
AI-powered methods go beyond traditional statistics by using model-based insights and unsupervised techniques. Here they are:
Model-Based Methods
These methods train a model to predict if the data is from the original training set or a new distribution. They're actually useful for models where even small changes in input features can seriously affect predictions.
Unsupervised Model Drift Detection
These methods use unsupervised learning to identify changes without predefined labels or results.
- Autoencoders. Autoencoders are neural networks that learn to represent data by trying to recreate it. If the reconstruction error goes up, it might mean there's a change or drift. They're great for analyzing time-series data from IoT sensors to find anomalies;
- Clustering methods. Clustering methods group similar data points together. If there are major changes in the clusters or their centers, it indicates data drift. These methods effectively respond to changes in customer data over time;
- Maximum mean discrepancy (MMD). MMD is a statistical test that measures how different two distributions are - it looks at the difference between their sample means in a high-dimensional space. This method is especially useful in supervised learning when comparing feature embeddings;
- Feature distribution tracking. Feature distribution tracking involves continuously monitoring the distribution of individual features and alerting when there’s a significant change. This is crucial for complex data, like genomic sequences, because it helps quickly identify important shifts.
3. Shift Visualization for Data Analysis
Visualization helps stakeholders see and understand drift patterns.
Histograms & Density Plots
Use visual representations to compare historical and current data, perfect for spotting changes in continuous features like customer age or transaction amounts. Plus, overlaying distributions makes it easy to see any shifts.
Box Plots
Box plots are an excellent way to show the spread and summary of data. They emphasize shifts by displaying changes in quartiles or identifying outliers. They're ideal for summarizing changes in median and variability in financial metrics.
Time-Series Plots
Time-series plots show how a feature changes over time. So, it becomes easy to spot any unusual patterns. They're great for tracking sales trends, especially during certain times like seasonal peaks.
Scatter Plots/PCA Projections
Scatter plots combined with techniques like PCA make it easier to view complex data in simpler forms. This helps spot changes or patterns in data with many features, like analyzing customer behavior.
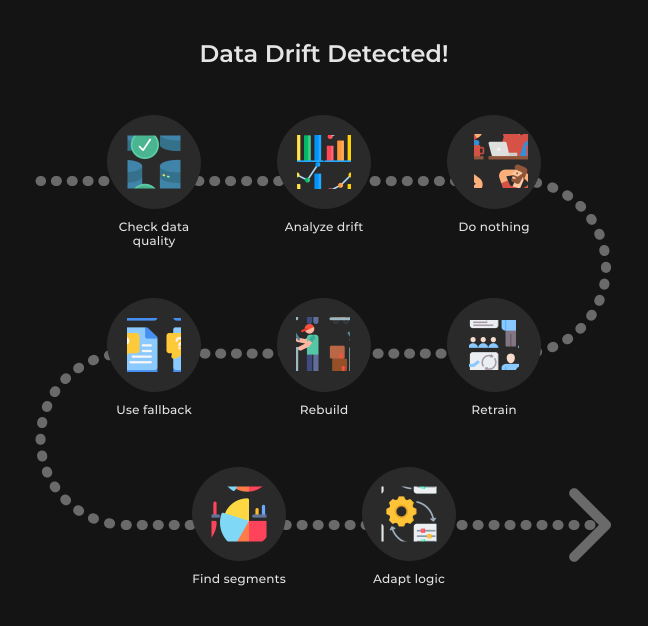
Using statistical, AI-powered, and visualization techniques together, organizations can create monitoring systems that detect data drift early. This allows for quick interventions to keep models working well and achieve business goals.
How AI Observability Helps Detect Data Drift
AI observability helps monitor how AI systems perform. It gives crucial info about data, models, and infrastructure, which is key to spotting data drift. Check out how AI observability allows you to detect and resolve data drift.
1. Data Observability
Data observability is all about keeping an eye on the data that models use. It ensures the data is of good quality and keeps track of any changes. For example, it helps to regularly check for anomalies, missing values, or outliers in incoming data.
Data observability tools can find changes over time by comparing current data to historical trends. AI observability platforms can also set up smart alerts to inform data engineers and scientists when the current data doesn't match what's expected.
2. Model Observability
Model observability allows us to understand how a model processes data and predicts. It shows model predictions, behavior changes, and overall performance.
This type of observability tracks KPIs like accuracy, precision, recall, and F1 score. So, you can easily notice when a model's results aren't as anticipated, which might signal data drift.
Observability tools also track how the significance of features changes over time. Big shifts might indicate that the data distribution affecting the model has changed.
Model observability can detect biases or changes in prediction accuracy by comparing predicted values to expected results, highlighting potential data drift issues.
3. Infrastructure Observability
Infrastructure observability monitors the systems and processes that manage data and deploy models. By watching data pipelines, you can ensure data is correctly ingested, processed, and transformed. If there are changes or issues, it can lead to data inconsistencies and drift.
Tracking CPU or memory allows us to figure out if changes in data size or complexity are slowing performance down. This can suggest potential issues when using new data sources or larger datasets.
Also, monitoring the differences between training and production environments can prevent performance issues. For example, variations in libraries or dependencies can affect results and cause perceived drifts.
Partner with SapientPro to Create Your Machine Learning Solution
SapientPro has been working with machine learning development for 8+ years. Our team turns data into valuable insights and collaborates closely with you to craft solutions that fit your needs. We know what businesses expect from their ML models, whether it's data processing or real-time insights.
Contact us to discuss your project and start building something exceptional together.
Build Your ML Model with SapientPro
Our engineers will help you build a new model or improve an existing one.
FAQ
When to Retrain Your Models?
When changes in the environment or data affect the model's performance, it's a sign for retraining. For example, if data patterns change, retraining can help the model adapt. It’s also a good practice to retrain models on a regular basis. This keeps them updated with the latest data trends.
2. How to Retrain Your Models?
Retraining means updating your model to match current data and situations. Here's a brief guide:
- Gather the necessary data.
- Prepare the data.
- Look at new features or changes to old ones.
- Choose and train a model.
- Swap out or add the retrained model to production.
- Monitor how the model performs and watch for data changes to know when to retrain again.
3. How to Prevent Data Drift Early On?
Some strategies for preventing data drifts include:
- Creating flexible data pipelines that can easily handle changes in data sources or formats;
- Using models that can adjust to changes in data features, staying reliable even if some features shift;
- Setting up active learning systems to constantly incorporate new and useful data into training.